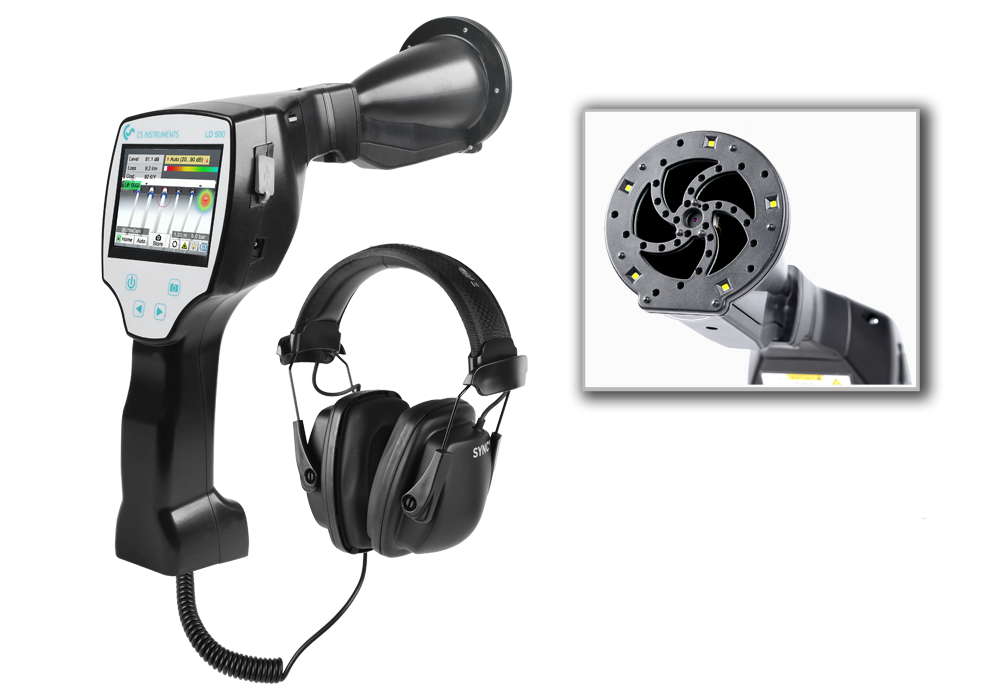
Ultrasound Camera UltraCam LD 500/510
uses 30 MEMS microphones for the Calculation and visualisation of the ultrasound image. The device also makes inaudible ultrasound audible.
In industrialised countries, around 10% of total industrial electricity consumption is used for Compressed air generation, in Germany the figure is as high as 14%. Leakages are the main factor in energy loss and most compressed air systems have Losses in the range of around 20% to 40%, in poor systems it is even more than 60%. Eliminating Compressed air leaks is the most effective way to reduce Energy consumption. Compressed air leaks often waste energy 8760 hours (24 h x 365 d) a year and increase Compressor run times, which also shortens Maintenance intervals. It is therefore a must to regularly detect and eliminate Leakages. Our LD series offers you all the features you need to detect Leakages and measure the consequences in terms of Energy consumption and money wasted.
High compressed air leakage rates and incorrectly designed components (Compressors and compressed air storage) reduce the efficiency of the compressed air system, generate unnecessaryCO2 emissions and also reduce competitiveness. A volume flow sensor can be used to measure very easily and reliably how much compressed air production requires over the course of a week and how the components need to be dimensioned so that they work as efficiently as possible and are utilised to capacity. In the graph shown you can see the volume flow profile measured behind the compressed air tank of a pharmaceutical company in South Africa for approx. 10 days.
The green curve corresponds to the actual measured volume flow profile (moving average) and the red curve corresponds to the volume flow profile after the "simulated" Leakage elimination. As you can see, the curve shifts downwards. During the times marked in red, production was at a standstill and no goods were being produced - in other words, Compressed air was escaping solely via Leakages and open nozzles. Of course, this value should always be as low as possible and should drop significantly once Leakages have been eliminated or other consumption optimisations have been made. Based on the following assumed values for the system, there is potential for improvement, which you can see in the table below.

| Unit | Measuring before rectification | Measuring after rectification | Improvements |
| Volume flow average [m3/h] | 500 m³/h | 250 m³/h | 250 m³/h |
| Volume flow no production [m3/h] | 316 m³/h | 66 m³/h | 250 m³/h |
| Leakage rate [%] | 63,2% | 26,4 % | 36,8 % |
| Savings potential [€ / a] | 75.840 € / a | 15.840 € / a | 60.000 €/a |
| CO2 emissions | 127.41 tonnes / a | 26.61 tonnes / year | 100.8 tonnes / year |
The following diagram shows the volume flow profile of a bakery that produces under the following conditions:
A VA 500 thermal flow sensor has been installed behind the compressed air tank to measure the consumption of the two halls. The following graphic shows the Compressor switching on and off in the original volume flow profile (light green). For better comparability, the moving average was therefore also calculated and plotted (dark green). The following findings can be derived from this: Although there was no production before 10:00 a.m., the Compressor delivers a lot of Compressed air. The real "production peaks" are very small compared to the base load. This indicates a very high Leakages rate. To confirm the assumption, the Ball valves to the machines in the shutdown area (in Hall 1) were closed so that their Leakages are no longer supplied with Compressed air. Most Leakages are typically found in and around machines. As the volume flow profile decreases steadily, it can be seen that the base load can be reduced enormously from closed ball valve to ball valve. This is an indication of the impact a leakage repair would have on the compressed air profile of this bakery.
If the machines in Hall 1 are operated again, the Ball valves must be opened and Compressed air escapes again via the Leakages.

The process described here should be carried out cyclically in the company in order to keep the Leak rate as low as possible in the long term. The aim of the measures should be to achieve a permanent leakage rate of 5-10%, as experience has shown that a one-off search and repair does not permanently reduce the leakage rate and new Leakages will naturally occur again afterwards.
Practical tip: In order not to miss the optimum time for the Leak audit, the use of a volume flow sensor (e.g. VA 500) in the main line behind the tank is recommended. Measuring is recommended for at least one week (Monday to Sunday). In addition, the volume flow measurement can be used to validate the result of the Leakages search and repair, as this must reduce the volume flow when the system is at a standstill.